Why Read?
This Google Shopping guide will allow you to quickly link your PPC spend to business profitability on an individual product basis. Enabling you to maximise spend on your most profitable products, and reduce spend on less profitable.
Ultimately, linking your PPC performance to your profitability as a business.
The Problem
On the surface, a PPC account may look like its performing well with strong ROAS or low CPA, but when you actually consider how a business operates, these metrics can actually be relatively useless if they are not aligned to the dynamics of your business, and specifically, aligned with the products you sell.
The questions you need to ask and answer are:
- Do I know which of my products have the highest & lowest margin?
- Do I know how much budget is being spent on each product by margin?
- How much opportunity is there to optimise my spend towards the products which deliver the most profit?
By reporting on an individual product level, rather than at a campaign level can make all of the difference to the current and future performance of your business.
At 54 Digital, one of our core aims is to align what is happening within our PPC accounts, to the way our clients and customers see the world from inside their business.
For any client, leveraging data and insights which looks beyond only PPC metrics can make a huge difference to business growth.
The core aim is to link our PPC performance data to internal business data, and get a much clearer picture of PPC spend, and how efficient this is.
Here we are focusing on eCommerce specifically, and utilising sometimes lesser known reports within Google Ads to assess performance. This way, you can really determine if you are spending in the right areas for shopping.
We will run through a full step-by-step guide that any PPC account manager, or business owner within an interest in their PPC activity can run. While there are a few steps involved, once the report is understood, it can be invaluable to achieving profitable growth.
Product Level Reporting
This is where product level reporting becomes so important. It’s quite often overlooked as it isn’t immediately obvious where to pull this data from.
There are two core strands to this, which we’ll run through in detail:
- Pulling data on a product level from Google Ads
- Aligning that data (generally with Item ID/SKU), to your internal business data
Making this short piece of analysis, can make a huge difference to the profitability of your clients, rather than the ROAS/CPA of the campaigns.
Pulling the data
In the main Google Ads campaign interface, it isn’t actually possible to pull a straightforward, simple list of all of your products and how they are performing.
If you go to Product Groups within Google Ads, this gives you an overview of performance but the data is only available in the way which you have segmented your campaigns, whether that’s Product Type, Brand, Custom Label or Product ID, you can’t view the data here in any way more granular than which you have segmented.
In short, for product level reporting, this view is pretty useless. I’m just mentioning here, so that you don’t have to spend valuable time trying to find out if you can download the data you need.
Pulling the correct Google Shopping data
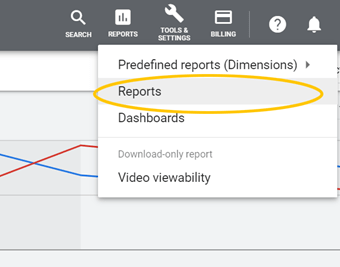
Product Level reporting, at an individual product ID level, in a nice, readable table is only available from the Google Ads dedicated reporting menu, found in the top-right of the Google Ads main view:
From this menu, you can build a table style report with all of the data you need.
We will end up with:
- Product ID
- Impressions
- Clicks
- Cost
- Conversions
- Revenue (conversion value)
Individual Steps To Pull The Report
- Go to Reports > Reports
2. Select Custom > Table in the top left
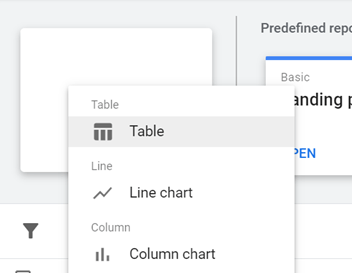
3. In the top right, you can search for the relevant columns you need:
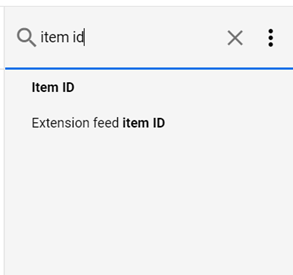
Include in Rows:
- Item ID
Include in columns:
- Impressions
- Clicks
- Cost
- Conversions
- Conversion Value
Pick a suitable time range for your business. Usually this may be 14/30 days data, but can also depend on seasonality of products and the insights you are looking to gain.
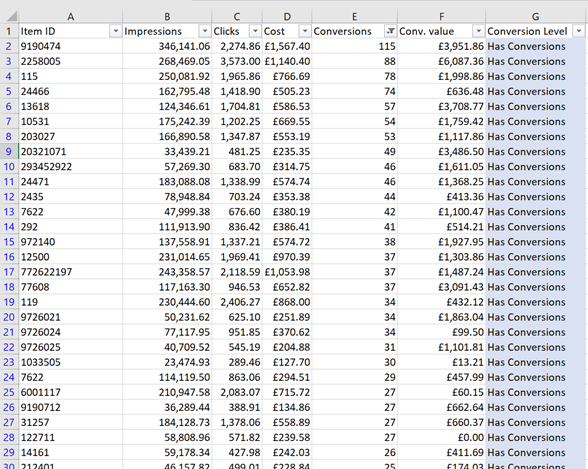
Download the data into Excel/Google Sheets and you should end up with a report which gives you all of the data you need and looks something like this:
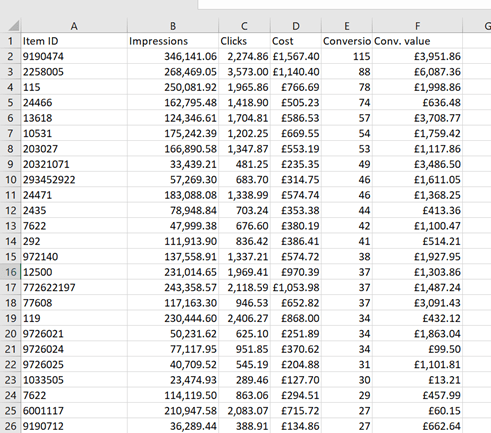
Right away, this is extremely useful data to have in a much more granular view that is readily available in the campaign view
Just a note that all of this data is example to illustrate the process.
Organising Our Data
There is a tonne of analysis which you can do with the data above by it is worth adding a couple of extra columns before we add product margin in here. The first column we will add is to classify each row (product) as either having conversions, or not having conversions.
Add a column Header in G called “Conversion Level”, filter the data on Column E (Conversions), and select all rows where conversions = 0:
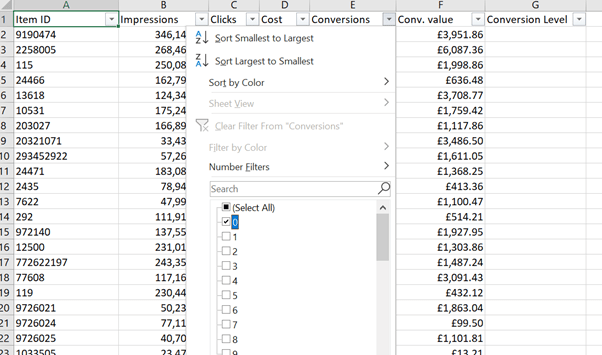
Label these rows as “No conversions” in column G:
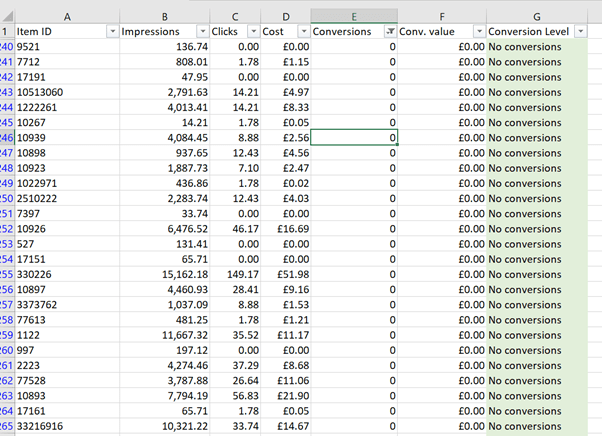
Filter on column E again, and select all values except 0, so every row which has had a conversion and label these “has conversions”:
Now you have all of your rows labelled with either “Has Conversions”, or “No Conversions”.
Just from this simple report, you can instantly see within a pivot table the efficiency of your overall PPC spend:
- How much are you spending on products which convert, and more importantly;
- How much are you spending on products which don’t convert?
Add Margin Into Your Data
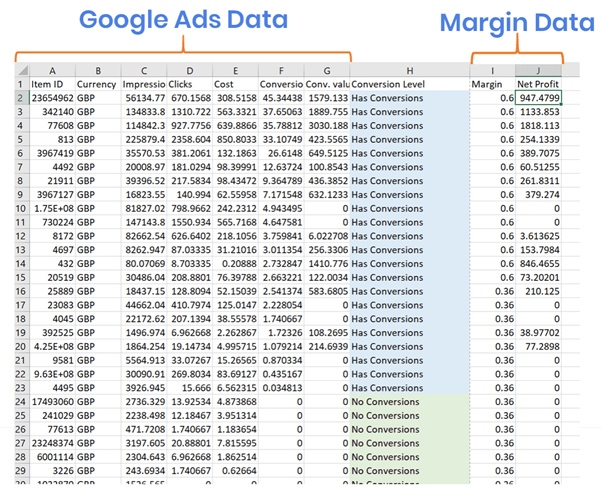
If you use any kind of product management system, hopefully the product IDs in your system will match the product IDs in your Google Shopping report. If this is the case, you can simply use the vlookup formula to match your margin from one sheet using product ID, to your Google Ads performance data in the report above.
This can also be done manually, but if you have a lot of products then completing manually would take a lot of time. With margin by product in your document, you can then calculate the actual profit you make on each product, generally, revenue/conversion value multiplied by your margin level if expressed as a decimal, as below
Creating Actionable Insights
With the data above, this can now be added into a pivot table to begin analysing your data.
Adding a pivot table
If you’ve never used pivot tables before they can be a little confusing, but once you get used to them, they are extremely powerful tools to analyse your data.
As an example, by using a column such as “conversion level” above, a pivot table can automatically sum all of your data based on this column.
If you know how to create a pivot table, you can skip this step. Otherwise, a brief overview of the individual steps is below.
Steps for creating the pivot table:
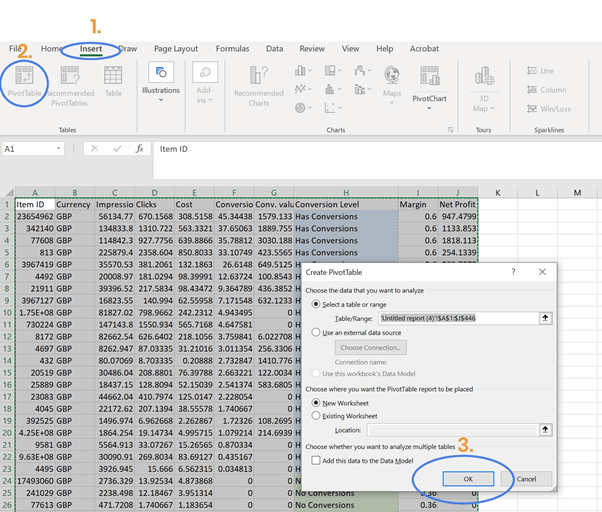
- Select you full data range including column headers, starting at cell A1. Select all data to the right and down to the final row of data
- Then Select, Insert > Pivot Table, and press OK to move to the next steps as highlighted below:
Adding your data to the pivot
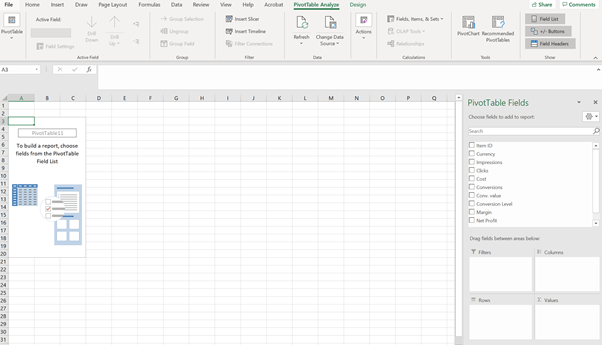
You have now created a blank pivot table as below.
Dimensions, such as “conversion level” can be used in either columns or rows, and metrics, such as cost, conversion value, net profit etc can be used in the values.
You simply select the field that you want from the right “PivotTable Fields”, and drag them into either Rows, Columns or Values.
In your pivot table, drag the rows:
Cost into Values
Conversion Level into Rows
Highlighted below:
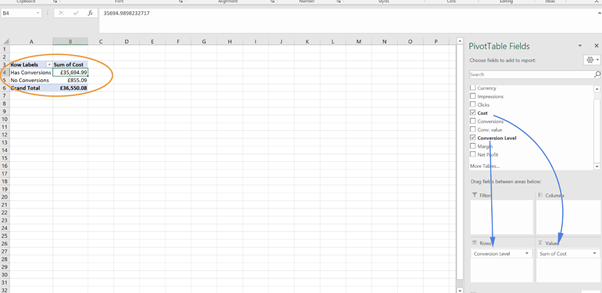
You will now end up with a basic pivot table, revealing exactly how much of your budget you are spending on converting, and non-converting products.
In the example data above, just 2.3% of spend (£855 out of £36,550) is on products without a conversion. Right away this is extremely useful to optimising your spend.
More insightful reporting
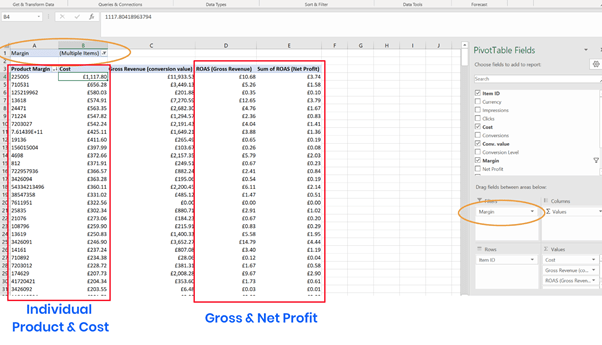
Margin can also be used in the pivot rows, and conversion value (gross revenue), and net revenue can be added as values.
From here, you can calculate return on ad spend (ROAS) against both Gross Revenue, and Net Revenue to give a much clearer picture of performance, and how this links back to the profitability, and media investment, based on the overall profit margin of each product.
Decisions can then be made, not just to support your PPC campaign and optimisation, but to support your own, or your client’s business to help growth revenue which is most profitable.
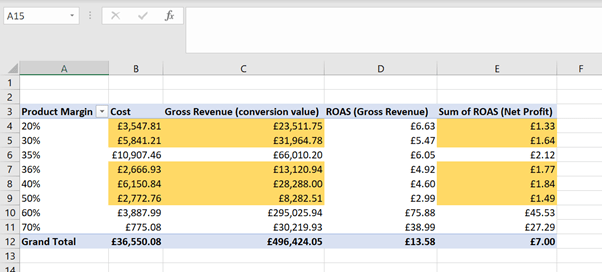
Using the relevant columns and data in the pivot table, we can see in the example data above that the media spend highlighted in orange is being spent on products which at first, with Gross Revenue look to be performing well, are actually all under £2 ROAS when taking margin and net profit into account.
It’s important to note here, that a profitable ROAS level is entirely down to your business and needs. £2 ROAS has been used as an example to demonstrate.
You can then look at individual products within those margin groups, by adding product margin level as a filter in the pivot, and Item ID as rows:
Summary & Conclusions
Although there appears to be a lot of steps involved here, the overall process and theory is straightforward:
- Pull product level data from Google Ads
- Match Your Margin level by product
- Add the data to a pivot table and analyse
Once you have the steps down, this report can be pulled regularly.
If you use tools such as Google Data Studio or Supermetrics, these reports can even be automated to get regular updates without having to manually pull the data each time.
Hopefully this overview on reporting at product level data and profitability for Google Shopping is useful. Feedback, comments and suggestions are more than welcome, and if you’d ever like to discuss further reports, or how this can be of use, just get in touch.
Reach out to us via the contact form or connect on Linkedin